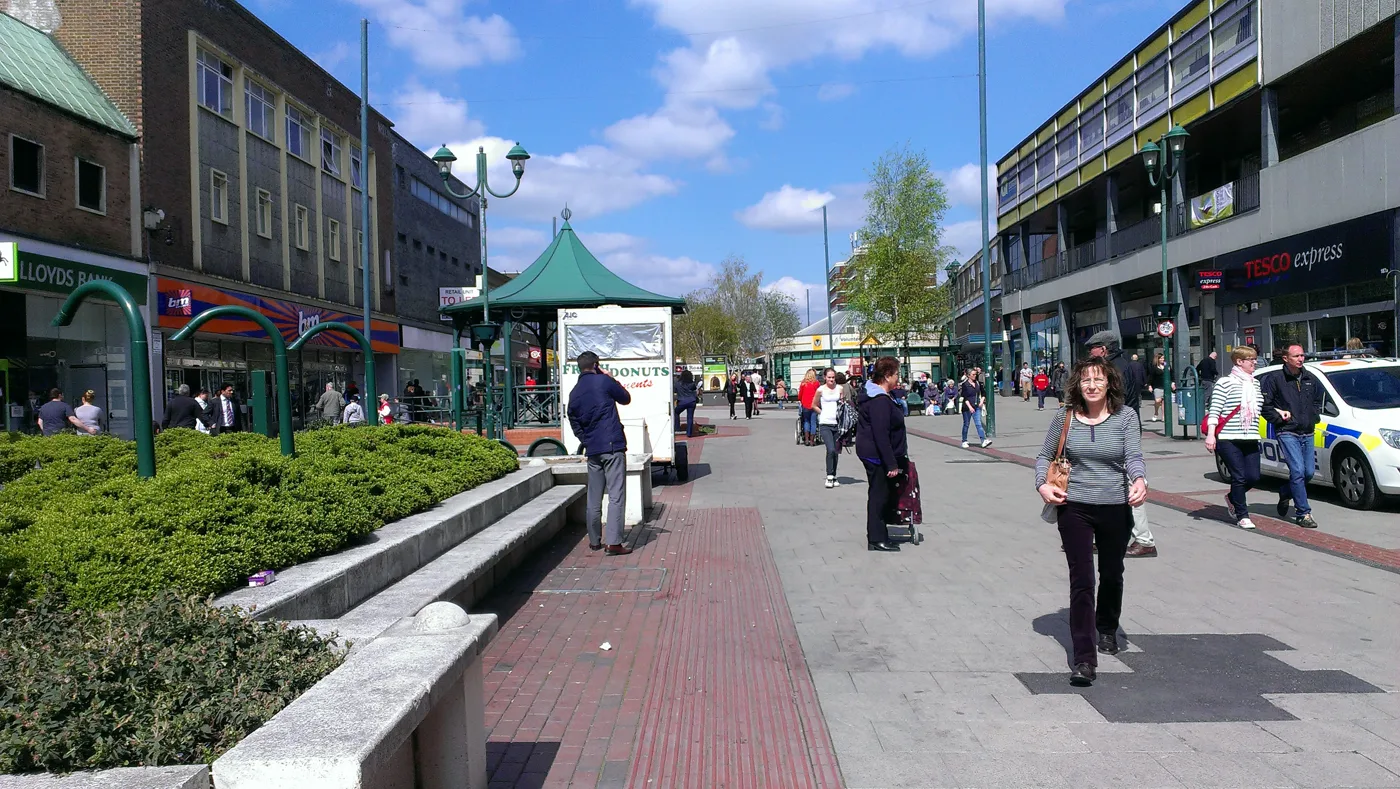

Hemel Hempstead Town ward is on 6.0%, Berkhamsted Castle on 0.9%, the lowest of 176 Herts wards. They sit 3.6 miles apart, and the 3.2% average hides both.
Dacorum contains both the highest and the lowest claimant-count ward in Hertfordshire, and they are less than four miles apart.
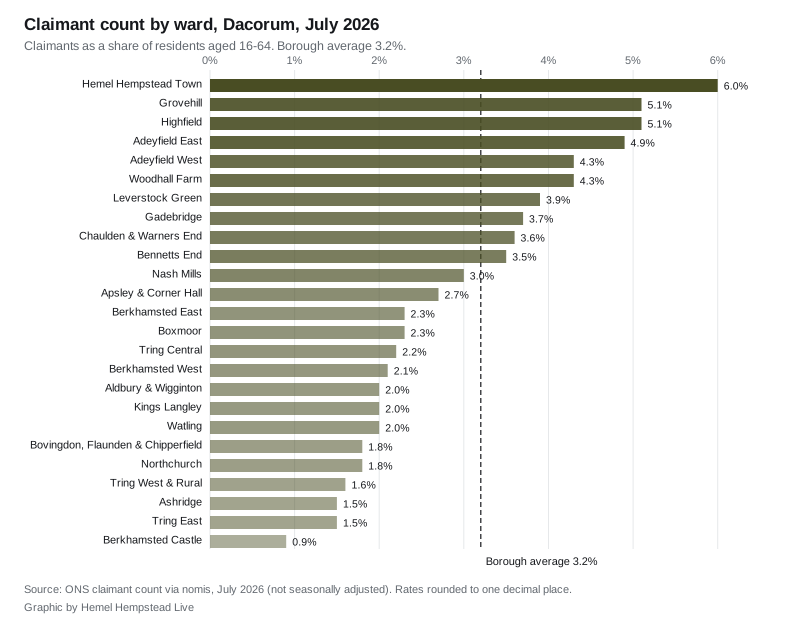
New figures for July 2026 put Hemel Hempstead Town ward on 6.0 per cent of residents aged 16 to 64 claiming unemployment-related benefits. Berkhamsted Castle ward is on 0.9 per cent, the lowest of all 176 wards in the county. The borough as a whole sits on 3.2 per cent, a figure that describes neither place (ONS claimant count via nomis).
Measured between the centre points of the two wards, they are 3.6 miles apart.
The split runs along the same line every time
The pattern is not scattered. The twelve highest wards in the borough all have Hemel Hempstead postcodes. The lowest are in Berkhamsted, Tring and the villages.
The highest rates in July 2026 were:
- Hemel Hempstead Town, 6.0% (335 people)
- Grovehill, 5.1% (250)
- Highfield, 5.1% (205)
- Adeyfield East, 4.9% (205)
- Adeyfield West, 4.3% (165)
- Woodhall Farm, 4.3% (200)
The lowest were:
- Berkhamsted Castle, 0.9% (35 people)
- Ashridge, 1.5% (20)
- Tring East, 1.5% (30)
- Tring West and Rural, 1.6% (55)
- Northchurch, 1.8% (30)
- Bovingdon, Flaunden and Chipperfield, 1.8% (105)
Hemel Hempstead Town is the joint highest ward in Hertfordshire, level on 6.0 per cent with Central and Holywell in Watford. Berkhamsted Castle is on its own at the bottom: the next lowest in the county is Hitchin Priory on 1.0 per cent.
Ward figures are published to one decimal place and rounded to the nearest five people, so the 25 wards sum to 3,195 against a borough total of 3,190.
The borough total has barely moved in two years
At borough level there is almost no news. Dacorum recorded 3,190 claimants in July 2026, against 3,195 in July 2025 and 3,280 in July 2024 (nomis, Dacorum time series). A change of five people in a year is not a trend.
The borough rate of 3.2 per cent is below the UK figure of 3.9 per cent. Within Hertfordshire, Dacorum ranks sixth of the ten districts, between Welwyn Hatfield and Three Rivers. Watford is highest on 4.5 per cent and East Hertfordshire lowest on 2.0 per cent.
The age breakdown is also calmer here than nationally. Claimants aged 16 to 24 in Dacorum rose from 505 to 525 over the year, up 4.0 per cent. Across the UK the same age group rose 9.7 per cent. Claimants aged 25 to 49 fell from 1,940 to 1,920, and those aged 50 and over fell from 750 to 740.
The gap has widened since January
Ward-level figures in this series begin in January 2026, so there is no year-on-year ward comparison yet. Over the seven months there are, the two ends have moved apart rather than together.
| Ward | January 2026 | July 2026 |
|---|---|---|
| Hemel Hempstead Town | 6.1% | 6.0% |
| Grovehill | 5.3% | 5.1% |
| Berkhamsted Castle | 1.3% | 0.9% |
Both ends fell, but Berkhamsted Castle fell further. The gap between the borough’s highest and lowest ward was 4.8 percentage points in January and 5.1 in July.
What it means for you
The claimant count is not the unemployment rate. It counts people claiming Universal Credit who are required to look for work, plus those on Jobseeker’s Allowance. Someone working part time on a low income can be included; someone unemployed but not claiming is not.
For residents, the practical point is that borough-wide figures are close to useless for judging your own area. Dacorum’s 3.2 per cent is an average of a town centre ward at 6.0 per cent and a Berkhamsted ward at 0.9 per cent. Anything allocated on the borough average, from funding formulas to service planning, is being aimed at a place that does not exist.
If you are claiming or are about to, support is administered through Jobcentre Plus rather than the council, but Dacorum Borough Council runs the local welfare and housing advice routes. Our guide to house prices across the district covers the cost that most often follows a change in income, and our planning news page tracks the employment sites coming forward across the borough.
Where these figures come from
All figures are ONS claimant count data for July 2026, published through nomis, and cover Dacorum borough and its 25 wards. Ward geography was confirmed against Office for National Statistics ward boundaries and checked to postcode level via postcodes.io. UK comparisons use the same nomis series, so they are on a consistent basis. Figures are not seasonally adjusted at ward level.
Have your say