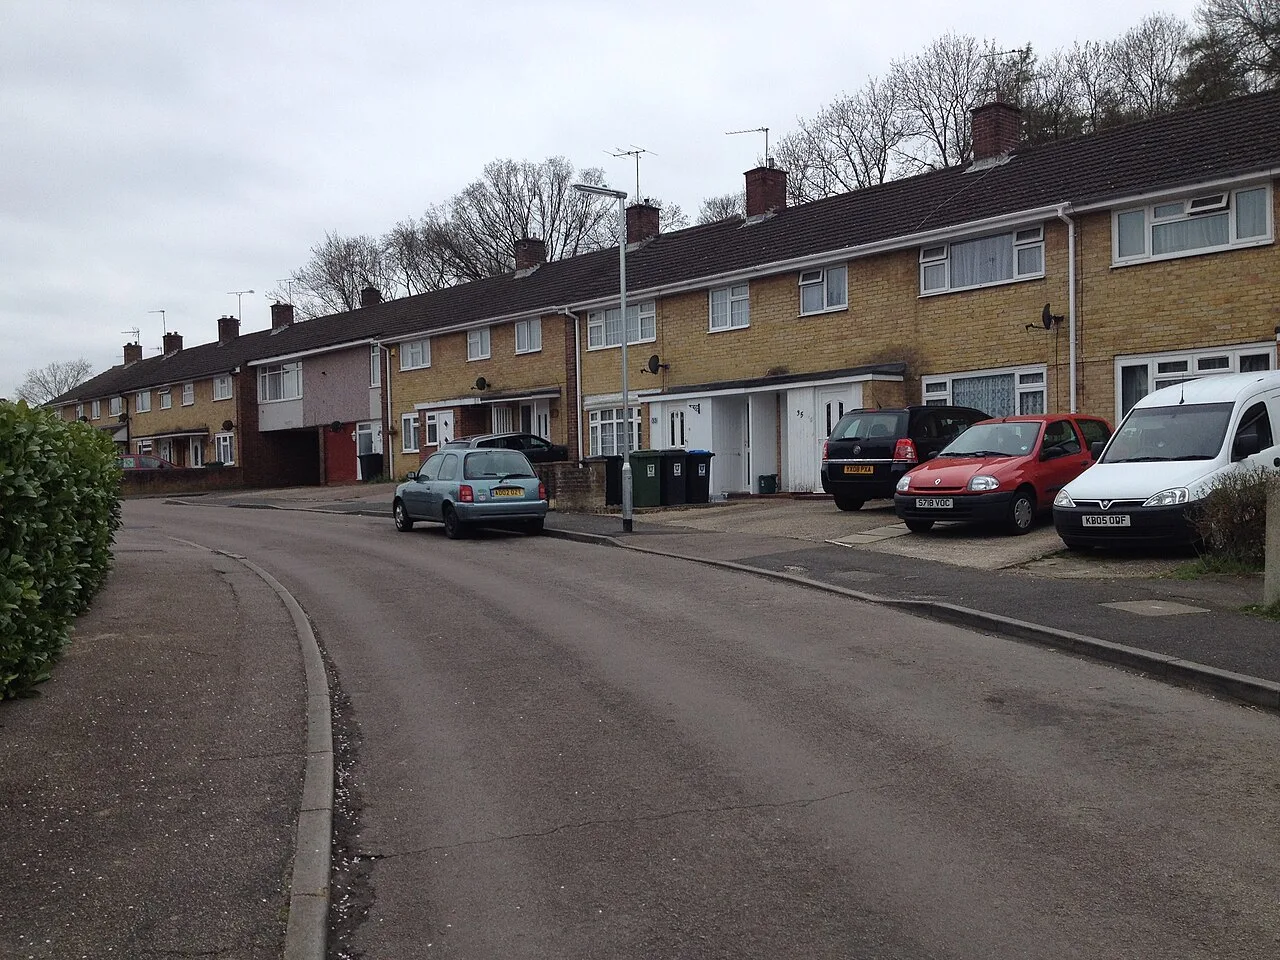

The average Dacorum home reached £459,438 in June, up 1.8% in a year. That is eighth of Hertfordshire's ten districts, and still £9,095 below the borough's November peak.
The average home in Dacorum was worth £459,438 in June 2026. That is 1.8% more than a year earlier, and the borough’s first clear annual rise since the winter. It is also less than half the rate at which Hertfordshire as a whole moved.
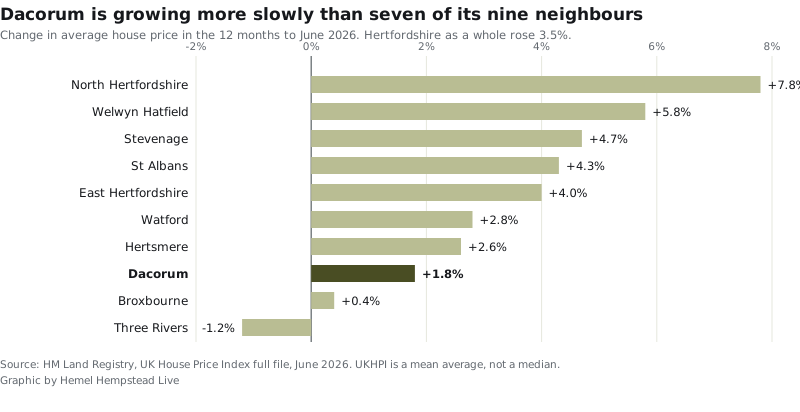
The county average rose 3.5% over the same twelve months, to £470,873. Of the ten Hertfordshire districts, only Broxbourne and Three Rivers grew more slowly than Dacorum (HM Land Registry, UK House Price Index).
First, a correction to our own figure
A week ago this site reported that the average Dacorum home had lost £16 in a year, at £454,770 in May. That was the published figure at the time. The Land Registry has since revised it.
May now reads £458,620, an annual rise of 0.8% rather than a fall of nothing. The revision is £3,850. Early months of the index are always provisional, because the Land Registry keeps adding completed sales to the file after it publishes. This is why the second and third versions of a month usually matter more than the first, and why we are naming the change rather than quietly moving on.
What actually rose
The lift did not come from the expensive end of the market.
| Property type | Average price | 12-month change |
|---|---|---|
| Detached | £931,786 | +0.6% |
| Semi-detached | £554,384 | +2.5% |
| Terraced | £425,299 | +3.0% |
| Flat or maisonette | £264,943 | +0.5% |
| First-time buyer | £371,338 | +2.2% |
Terraced houses rose fastest, at 3.0%. Semis followed at 2.5%. Detached homes moved 0.6% and flats 0.5%, which after inflation is a fall in real terms.
That pattern is worth naming, because it is the opposite of the one Dacorum had during the pandemic years. The money is going into the cheaper two thirds of the market. A terraced house in Hemel Hempstead is now a little harder to reach than it was; a detached house in Berkhamsted is not.
Dacorum is no longer the fourth dearest district in the county
Between at least June 2025 and March 2026, Dacorum was the fourth most expensive of the ten Hertfordshire districts. In April 2026 East Hertfordshire went past it, and it has stayed ahead since. In June the gap was £1,340.
| District | Average price | 12-month change |
|---|---|---|
| St Albans | £651,448 | +4.3% |
| Three Rivers | £580,120 | -1.2% |
| Hertsmere | £560,436 | +2.6% |
| East Hertfordshire | £460,778 | +4.0% |
| Dacorum | £459,438 | +1.8% |
| Welwyn Hatfield | £450,696 | +5.8% |
| North Hertfordshire | £422,616 | +7.8% |
| Broxbourne | £406,678 | +0.4% |
| Watford | £396,385 | +2.8% |
| Stevenage | £323,429 | +4.7% |
North Hertfordshire’s 7.8% is the striking number on that list. Welwyn Hatfield managed 5.8% and Stevenage 4.7%. The three fastest risers in the county are all cheaper than Dacorum, which is what a market looks like when buyers are shopping on price rather than postcode.
How Dacorum compares with the rest of England
Set against the country rather than the county, Dacorum looks ordinary. Its 1.8% is exactly the England figure, and it ranks 189th of the 295 English local authority districts on annual growth. Sixty-two of those districts recorded a fall.
Two other benchmarks from the same release:
- England: £293,262, up 1.8%
- United Kingdom: £272,188, up 2.0%
- East of England: £338,707, up 1.1%
Dacorum therefore beat its own region and matched the country, while trailing its county badly. Hertfordshire is simply having a stronger year than the East of England around it.
The borough is still below its peak
Dacorum’s highest recorded monthly average was £468,533, in November 2025. June 2026 is £9,095 below that. Prices dipped through the winter, bottomed at £449,338 in April, and have climbed in each of the two months since.
So the honest summary is a recovery that has not finished. Anyone who bought at the top of last autumn is, on these averages, still behind.
A note on the sales figures
The index publishes prices faster than it publishes volumes, so the most recent count of Dacorum sales is April 2026, at 108. March 2026 recorded 125.
Comparisons with spring 2025 do not mean what they look like. Dacorum logged 331 sales in March 2025 and 62 in April 2025, either side of the stamp duty threshold change on 1 April that year. Buyers rushed to complete before the deadline and the following month collapsed. Any “sales down 80% on last April” line drawn from those numbers is an artefact of the tax calendar.
What it means for you
- If you are selling a terraced or semi-detached home, you are in the part of the Dacorum market that moved this year. Terraced stock is up 3.0% and semis 2.5%.
- If you are selling a detached house or a flat, the annual change is 0.6% and 0.5%. Neither has kept pace with inflation, so price to the market rather than to last year’s asking prices nearby.
- If you are buying, the county is rising faster than the borough. On these figures your money currently stretches further in Dacorum than in East Hertfordshire, St Albans or Welwyn Hatfield, and the first-time buyer average here is £371,338.
- If you are tracking your own home’s value, remember this is a mean average across three towns and everything from a Tring flat to a Little Gaddesden farmhouse. It is not a valuation.
One caveat on every figure above. The UK House Price Index is a mean average, not a median, so a small number of very expensive sales pull the Dacorum number upwards. That matters more here than in most districts, because the borough contains both new town terraces and some of the priciest villages in Hertfordshire.
For the longer view of what each of the three towns costs, and how the commute prices into it, see our pages on Hemel Hempstead house prices and train times to London. New supply is tracked on our planning news page.
Sources
- HM Land Registry, UK House Price Index, Dacorum, June 2026 for the borough average, the monthly and annual changes and the property type splits.
- UK House Price Index full file, June 2026 (CSV) for the ten Hertfordshire districts, the national ranking of 295 English local authority districts, the sales volumes and the revision to the May figure.
- HM Land Registry, UK House Price Index, Hertfordshire for the county average.
Figures are HM Land Registry UK House Price Index data for June 2026, published 19 August 2026 under the Open Government Licence. The index is revised each month as further sales are registered.
Have your say